BaToVis
Research collaboration between University of Bari and University of Turin, aimed toTowards Intelligible Graph Data Visualization using Circular Layout
Participants:
Vladimir Guchev, Cristina Gena, Paolo BuonoDescription:
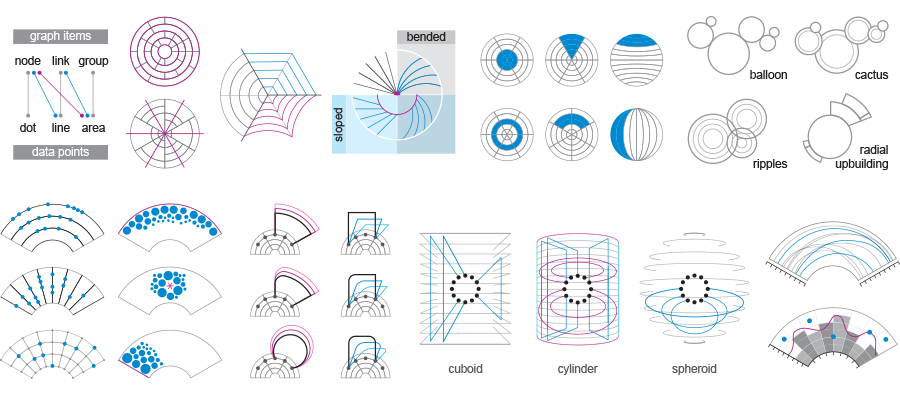
Polar coordinates have been widely used in various techniques of interactive data visualization. The spatial organization through circular and radial layouts is implemented in a wide range of statistical charts and plots and is applicable for space-filling techniques and for node-link-group diagrams. Different arrangements of dots, lines and areas in polar coordinates create grids for data distribution, aggregation and linking.Publications:
Vladimir Guchev, Paolo Buono, Cristina Gena, Towards intelligible graph data visualization using circular layout.